Fig. 5.

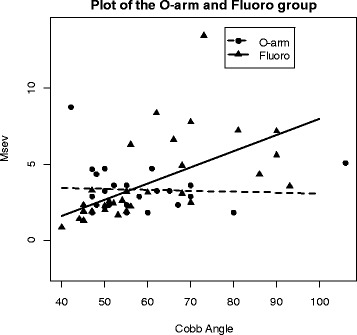
Scatter Plot of effective dose plotted vs cobb angle. Plot of the data for both the O-arm and Fluoro group. It depicts the linear regression lines for each and exhibits the different slope values

Scatter Plot of effective dose plotted vs cobb angle. Plot of the data for both the O-arm and Fluoro group. It depicts the linear regression lines for each and exhibits the different slope values