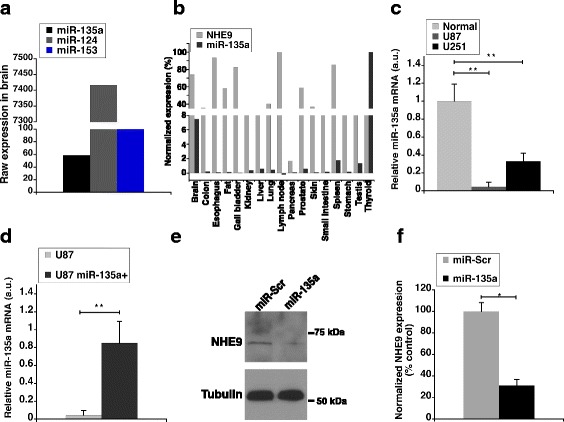
Fig. 2.

miR-135a-5p downregulates NHE9 protein expression. a Raw expression values of miR-135a, miR-124 and miR-153 were obtained from human miRNA tissue atlas. MiRNA abundance in brain from tissue biopsies of two normal (i.e. cancer free) individuals was conducted using SurePrint 8 × 60 K Human V19 and V21 miRNA microarray analysis as previously described [30]. b Comparative analysis of NHE9 mRNA and miR-135a expression profiles across various tissues. NHE9 mRNA expression profile was obtained from RNA-seq analysis performed of human tissue samples from 95 normal (i.e. cancer free) individuals as described previously [31]. MiRNA expression profile was obtained from human miRNA tissue atlas [30]. Normalization was done as a percentage relative to tissue with highest expression. c Mir-135a expression levels in U87 and U251n cell lines relative to normal human brain tissue. d qPCR analysis of miR-135a from U87 cells transfected with miR-135a mimic relative to control U87 cells. e Immunoblots of U87 cell lysates transfected with miR-135a or scrambled control mimic were probed using anti-NHE9 and anti-tubulin antibodies. f NHE9 protein expression levels determined by western blotting. Graphs represent average band intensity from densitometric scans of immunoblots from three biological replicates. Error bars represent standard deviation (SD), *p < 0.05 and **p < 0.01. Statistical analysis was done using student’s t-test
