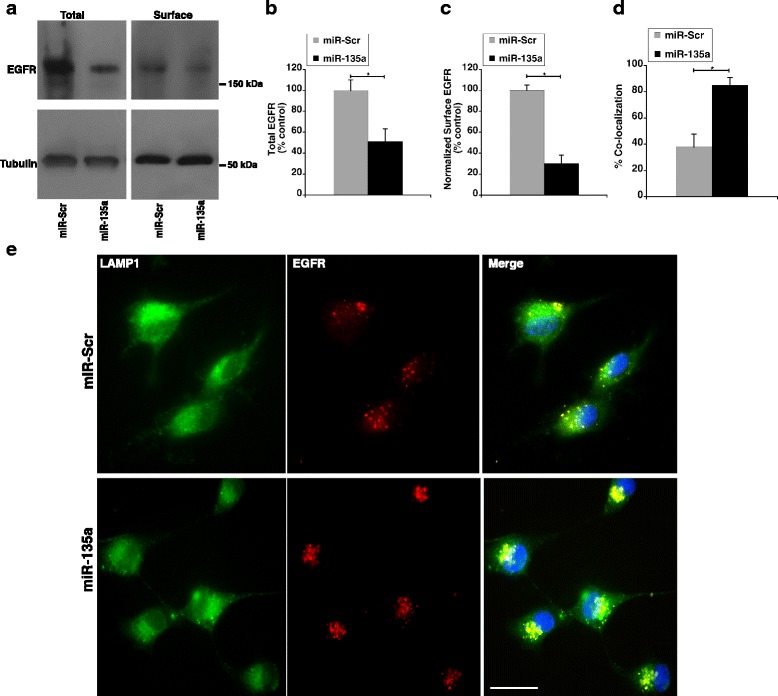
Fig. 5.

miR-135a regulates NHE9 to limit number of EGF receptors on cell surface. a Immunoblot showing total and plasma membrane epidermal growth factor receptor (EGFR) expression levels from U87 cells transfected with miR-135a or scrambled control. EGFR expression on plasma membranes was determined by surface biotinylation (b and c) Graphs represents average band intensity from densitometric scans of immunoblots from three biological replicates. Surface EGFR levels were normalized to total EGFR protein. MiR-135a not only downregulates EGFR expression but also limits EGFR presence on the cell surface by inhibiting NHE9 expression. d Quantification of colocalization between LAMP1 and EGFR signals is shown in the graph (n = 30 cells). Signal intensity and colocalization were measured with Image J software. Error bars represent standard deviation (SD); *p < 0.05. Statistical analysis was done using student’s t-test. e Colocalization of LAMP1 (green) and EGFR (red) images from immunofluorescence staining in U87 cells transfected with miR-Scr and miR-135a. DAPI staining is shown in blue. Colocalization is indicated by yellow in the merge. Scale bar is 50 μm
