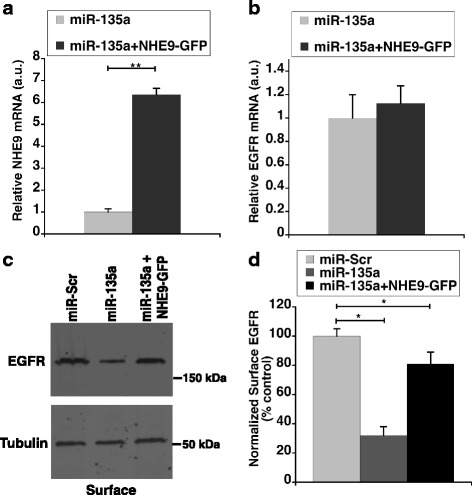
Fig. 6.

Ectopic NHE9 expression in miR-135a transfected cells rescues plasma membrane EGFR expression. a Relative increase in NHE9 transcript upon ectopic expression of NHE9-GFP in miR-135a transfected U87 cells determined by quantitative real-time PCR analysis (b) No significant change in EGFR transcript is observed in miR-135a transfected U87 cells upon ectopic expression of NHE9-GFP (c) Immunoblot showing rescue of epidermal growth factor receptors (EGFRs) on cell surface upon ectopic NHE9-GFP expression in U87 cells transfected with miR-135a. EGFR expression on plasma membranes was determined by surface biotinylation (d) Graph represents average band intensity from densitometric scans of immunoblots. Surface EGFR levels were normalized to total EGFR protein. All graphs represent an average of at least three biological replicates. Error bars represent standard deviation (SD), *p < 0.05 and **p < 0.01. Statistical analysis was done using student’s t-test
