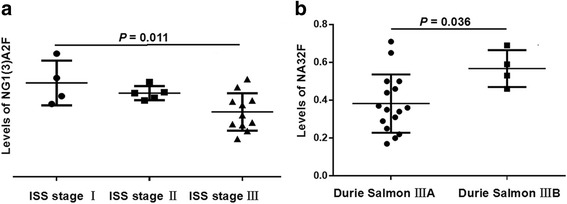
Fig. 2.

Comparison of the serum N-glycan structures according to different disease stage systems in IgD MM patients. a The tendency towards lower levels of NG1(3)A2F (peak4) was present in patients with a higher ISS stage, and levels of NG1(3)A2F were significantly different between ISS stage I and ISS stage III. b The levels of NA3F2 (peak10) were significantly higher in Durie Salmon stage IIIB than in stage IIIA
