Fig. 2.

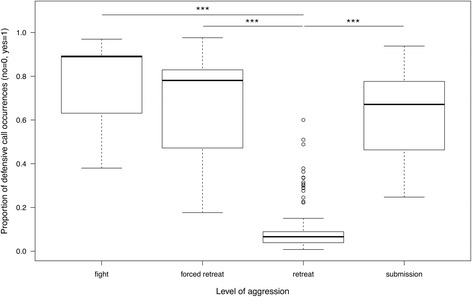
Estimated mean proportion of defensive call occurrences for different levels of aggression. Whiskers represent 1.5XIQR, bold lines denote the median, and circles show outliers. Asterisk indicate p≦0.001

Estimated mean proportion of defensive call occurrences for different levels of aggression. Whiskers represent 1.5XIQR, bold lines denote the median, and circles show outliers. Asterisk indicate p≦0.001