
Fig. 1.
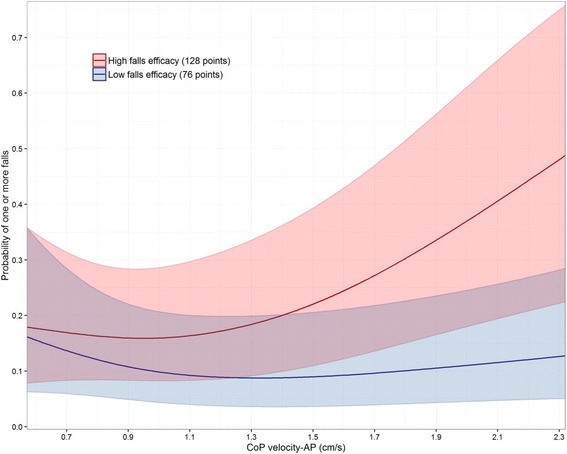
Interaction plot of Modified Falls Efficacy Scale (MFES) and centre-of-pressure (CoP) velocity-AP and probability of falling at least once in the follow-up period. Low and high falls efficacy represent the 25th and 75th percentile values of the MFES, respectively. Predicted fall risk was computed from a proportional odds model which included the interaction between MFES and CoP velocity-AP, adjusted for age, sex, number of comorbidities, fall history, baseline SPPB, and treatment group assignment (P = 0.014 for interaction). Shaded regions represent 95%CIs for the natural spline-smoothed estimates