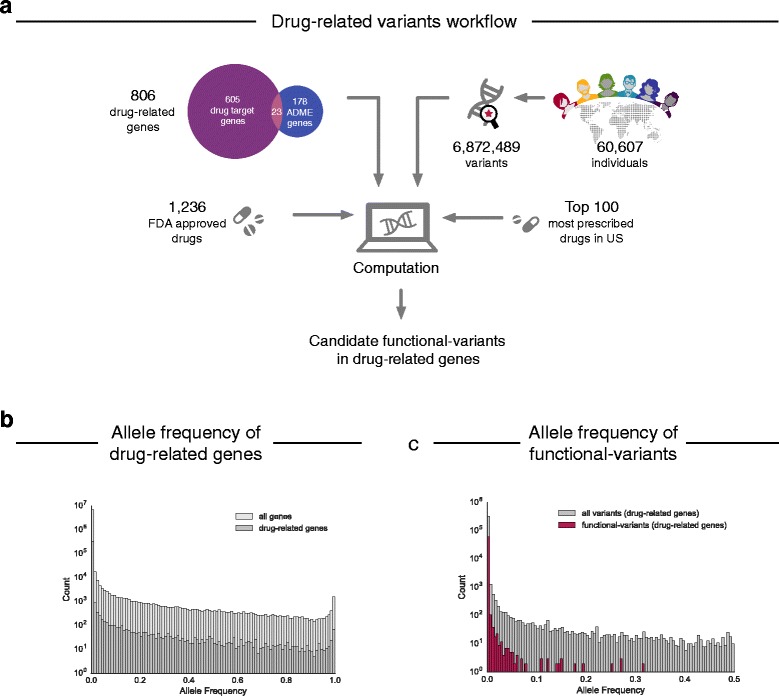
Fig. 1.

Analysis of genetic variation in drug-related genes. a The analysis pipeline consisted of collation of exome data from ExAC [19], identification of drug–gene relationships from DrugBank [23] and prescription information [24], followed by filtering steps and subsequent computational analysis to investigate drug-specific risks of pharmacogenetic alterations in patients. b Comparison of the allele frequency distribution between non-synonymous variants of all human genes (n = 17,758) and non-synonymous variants in drug-related genes (n = 806) collated from ExAC. c Comparison of the allele frequency distribution between functional variants as predicted by LOFTEE [28], Polyphen-2 [29], and SIFT [30] and all non-synonymous variants in the drug-related genes
