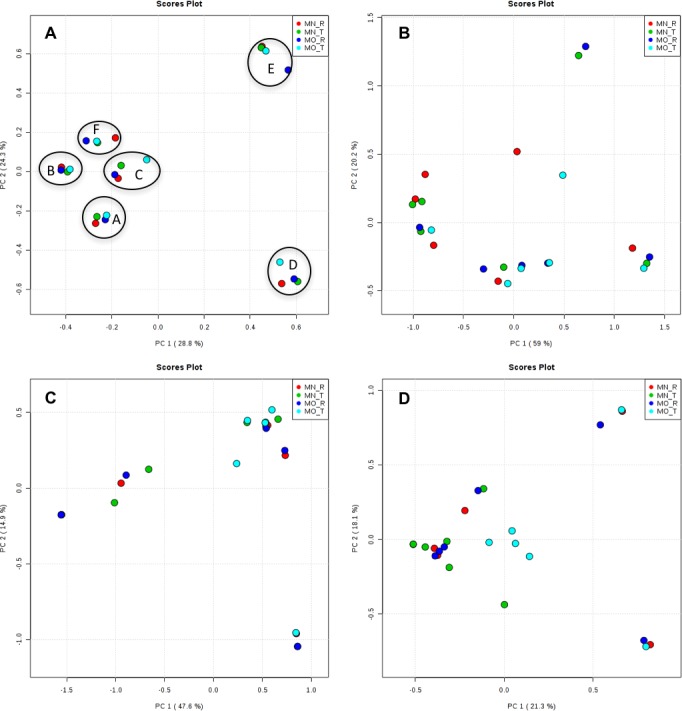
Figure 6. Principal component analysis (PCA) plots of OTUs among kits and researchers.

The black circles in bacteria (A) showed one cluster of each sample. A, B, C, D, E, and F; samples name, MN, NucleoSpin® Soil Kit; MO, PowerSoil® DNA Isolation Kit; R, Researcher R, T, Researcher T. (A) bacteria; (B) archaea; (C) fungi; (D) other eukaryotes.
