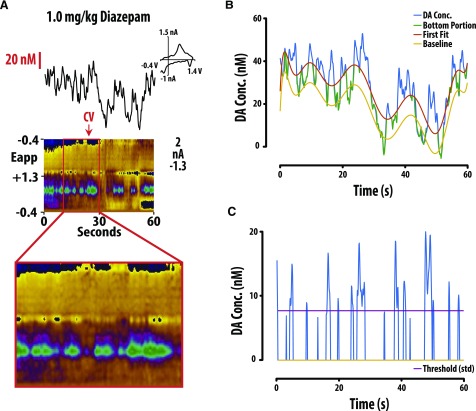
Fig. 1.
DA frequency was determined by establishing threshold concentration values to isolate transient release events from background current. (A) Representative color plot and associated DA concentration (Conc.) when 1.0 mg/kg diazepam is administered i.v. Representative color plots topographically depict the voltammetric data with time on the x-axis, applied scan potential (Eapp) on the y-axis, and background-subtracted faradaic current shown on the z-axis in pseudocolor. DA release events can be identified by an oxidation peak (green) at +0.6 V. (B) Extracted DA concentration was then fitted with a polynomic line shifted by +3 times the standard deviation of a region with minimal transient activity. (C) Only release events above the threshold (3× S.D.) that were more than 0.5 seconds apart were counted as transients. Conc., concentration; CV, cyclic voltammogram.

