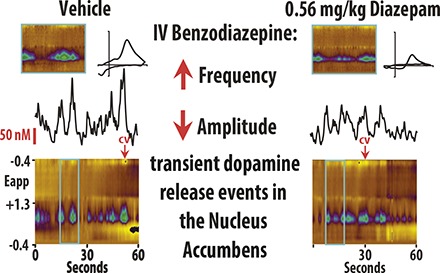
Fig. 6.

Histograms showing total transients in the shell (top) and core (bottom) across baseline, vehicle, and all diazepam conditions. These figures illustrate both a diazepam-induced loss of higher-amplitude DA events and an increase in lower amplitude DA events.
