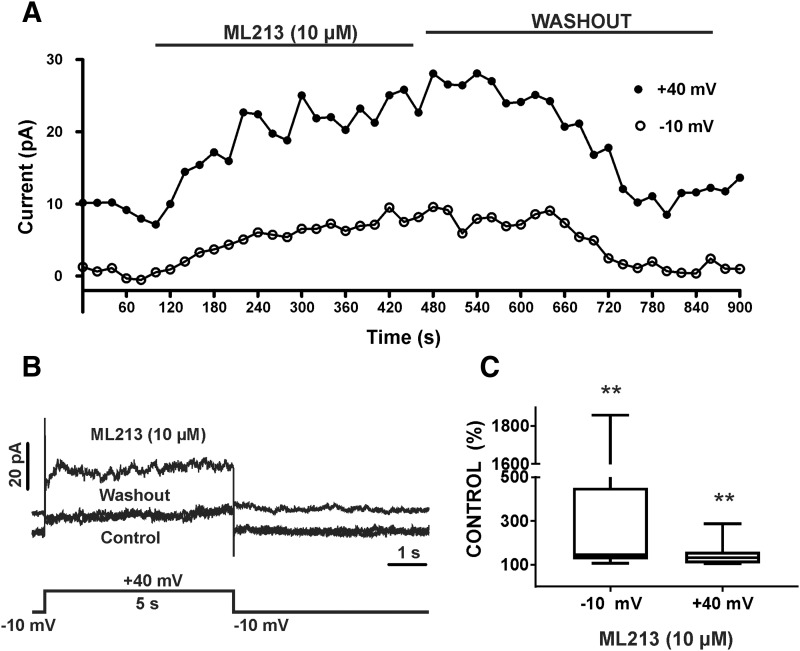
Fig. 9.
Time course of ML213-induced activation of KV7 channel currents in freshly isolated DSM cells. (A) Effects of ML213 on KV7 currents recorded using a one-step voltage-clamp protocol with a 5-second duration stimulus applied every 20 seconds from a −10-mV holding potential to +40 mV. (B) Representative traces (and voltage step used) of the experiment plotted in (A) for the control, ML213 (10 µM), and washout of ML213. (C) Summary data for the percentage of KV7 currents in the presence of ML213 compared with control at −10 and +40 mV, respectively (n = 8, N = 5, **P < 0.01; two-tailed Wilcoxon matched-pairs signed rank test). Summarized data illustrate the average of four to six points of each steady-state current. See Supplemental Fig. 9 for display of summary data as scatterplots with medians.

