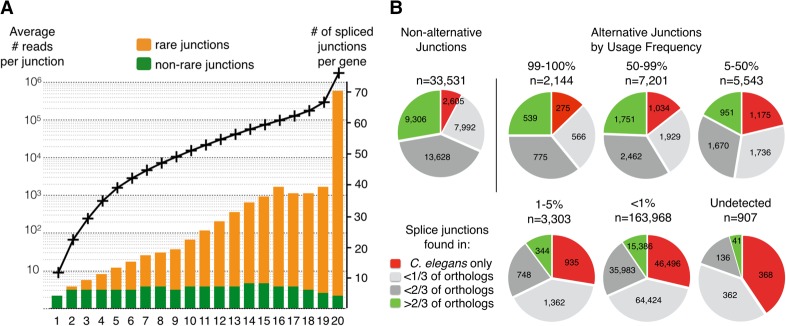
Figure 2.
(A) Introns with low inclusion rate are overrepresented in highly expressed genes. All C. elegans genes were ranked according to their expression level (defined by the highest read count for an intronic junction of that gene) and split in 20 bins of about 1000 genes. For each bin (x-axis), the average expression level (black curve; left axis) and the number of observed splice junctions per gene are plotted. Rare junctions (with an inclusion rate <1%) are represented in orange and commonly used junctions in green on the bar graph (axis on the right). (B) Frequently used splice sites are more conserved than rarely used ones. Conservation analysis for pairs of donor and acceptor splice sites grouped by relative inclusion level. For each gene, the genomic sequence was aligned with each available ortholog from seven nematode species (see Methods). The indicated conservation fraction is the number of genes for which both sites were present, divided by the number of orthologous genes identified.

