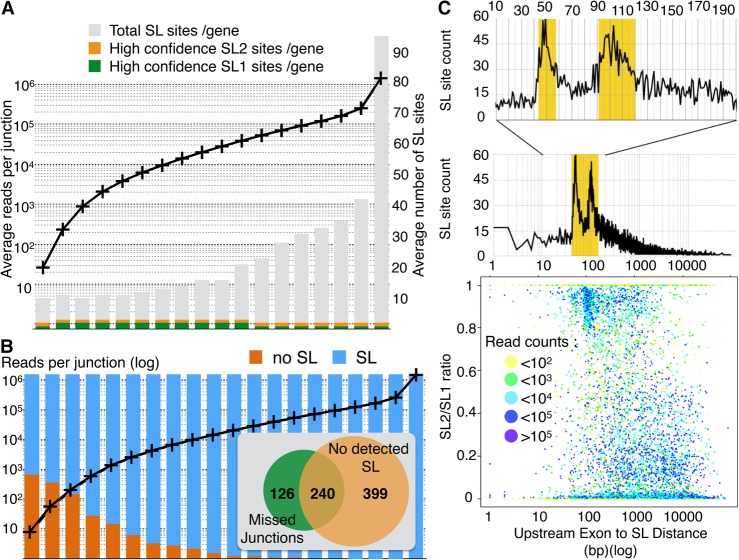
Figure 3.
(A) All genes for which at least one robust SL site was detected were ranked according to their expression level (as defined by the highest read count for an intronic junction of that gene) then grouped in bins of about 1000 genes. For each bin, the average expression level (left axis) and the average number of SL site per gene found are plotted. Here we counted as high-confidence sites that contained at least 25% of the SL-containing reads of that gene. (B) Genes without detectable trans-splicing have mostly low expression levels. All C. elegans genes were ranked according to their expression level (defined by the highest read count for an intronic junction of that gene) and split in 20 bins of around 1000 genes. For each bin, the average expression level (black curve; left axis) is plotted. For each bin, we represented the fraction of genes for which no SL junction was found (orange) and for which at least one robust SL site was found (blue). For the 1000 genes with the lowest expression level, we inserted a Venn diagram representing the number of genes for which either some predicted cis-junctions were missed and/or no SL site was detected. (C) A scatter-plot of the ratio of SL2/SL1 reads found at each robust splice site against the distance to the closest upstream exon shows a discernible bias for sites with >80% SL2 splicing to be located at ∼100 nt downstream from the nearest exon. Each dot is colored according to the number of sequencing reads supporting the corresponding SL site. A zoomed plot of the number of occurrences of SL sites at each distance shows two sharp peaks indicative of a strong preference for SL2 splicing to occur either at a distance of ∼50 nucleotide (nt) or ∼100 nt downstream from the previous exon.

