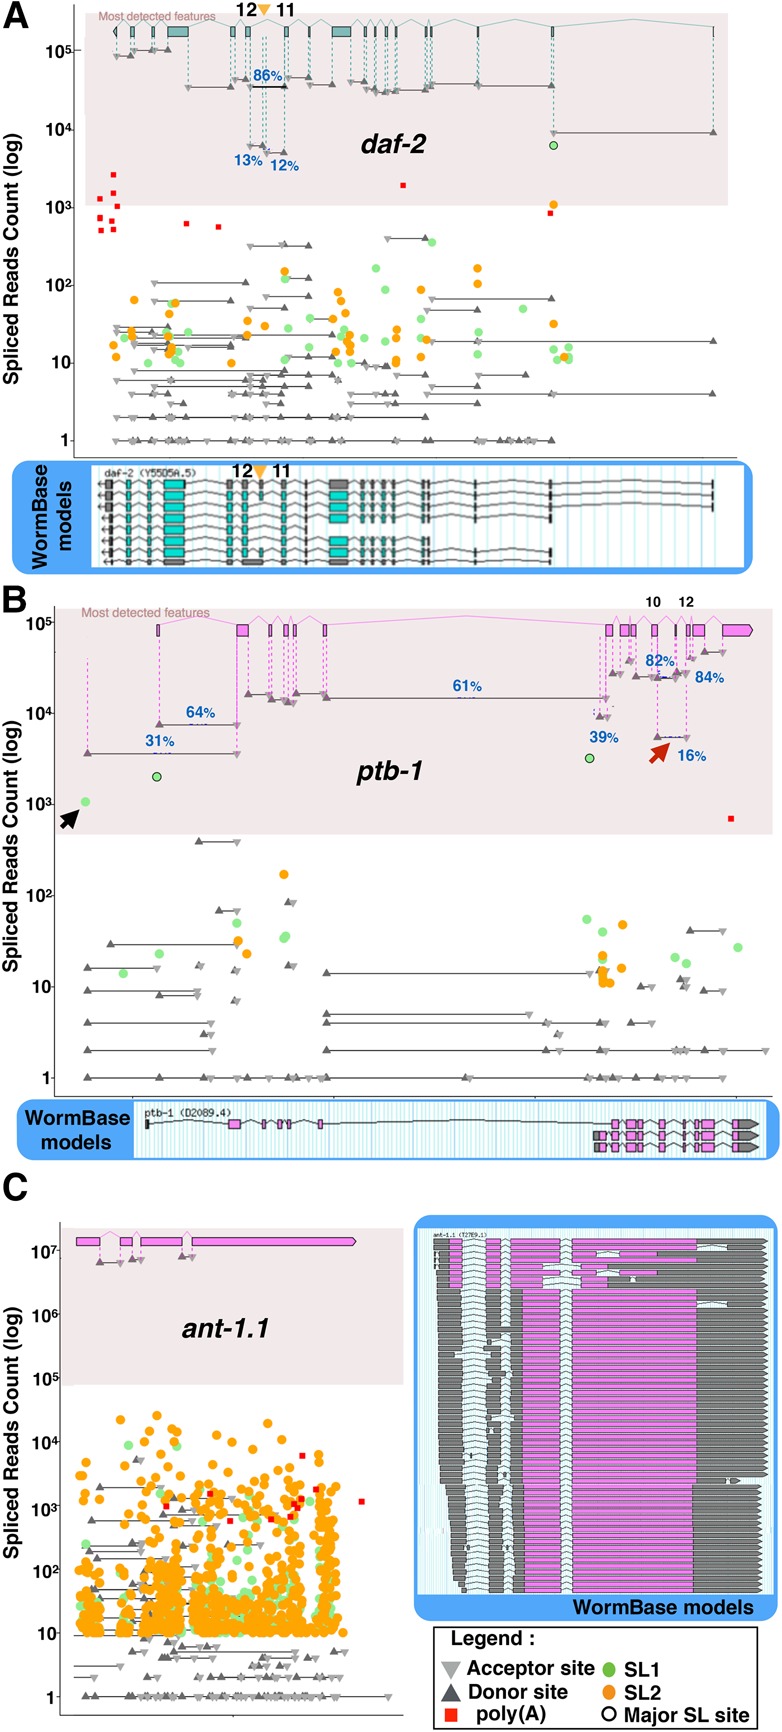
Figure 4.

Quantitative visualization of relative splice-sites usage. We present a gene model constituted of the most commonly detected exons, associated with the absolute read count for each cis- and trans-splicing event in the gene, as well as detected poly(A) tail addition, on a logarithmic scale. We highlighted the area containing high-confidence events (detected in at least 1% of the transcripts) and included junction usage frequencies for alternative events. As a reference we include the current WormBase model. (A) daf-2: Exon junctions corresponding to the inclusion of exon 11.5 (orange arrowhead) specific to a small subset of neurons during starvation are detected at ∼15% of the level of other junctions. Evidence of trans-splicing at exon 2 and a 10-fold increase in read numbers between introns 1 and 2 seem to indicate that this is in fact the most used expression start for this gene. (B) The ptb-1 gene has two confirmed alternative promoters active in two distinct neuronal subsets. In our data analysis, this manifests as two major SL1 trans-splicing junctions associated to the detection of the corresponding isoform-specific exon–exon junctions. Note how common junctions are detected with a level corresponding to the sum of both isoform-specific rates downstream from the second promoter. Our data seem to support the existence of a third unverified promoter with a lower activity (black arrow). We also detect an exon junction between exon 10 and exon 12, indicating that ∼16% of the transcripts are skipping exon 11 (red arrow). (C) The ant-1.1 gene had over 50 isoforms predicted in WormBase. Our RNA-seq analysis detected the three constitutive junctions with over 6 million reads each. All other junctions are orders of magnitude below the overall expression level of this gene, indicating that there is only one functional isoform of ANT-1.1.
