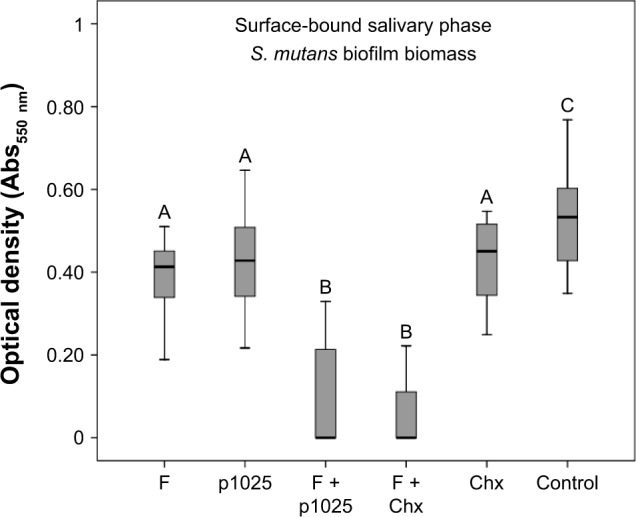
Figure 6.

Quantification of Streptococcus mutans biofilm biomass after 24 hours treatment in the surface-bound salivary phase.
Notes: Bars indicate minimum and maximum values. Boxes indicate lower and upper quartiles, respectively. Lines in the middle of boxes are medians (n=12). Different uppercase letters indicate statistical differences among the groups, according to Kruskal–Wallis/Mann–Whitney tests (P<0.05).
Abbreviations: F, liquid-crystalline formulation; p1025, peptide p1025; Chx, chlorhexidine.
