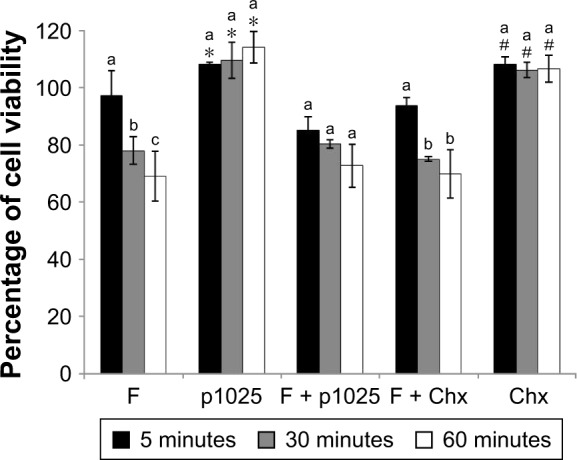
Figure 8.

Epithelial cell viability after 5, 30, and 60 minutes of treatment and growth for 24 hours.
Notes: *Significant difference between p1025 and the other groups (F, F + p1025, F + Chx), except for Chx, considering each time of exposure separately, according to ANOVA/Tukey’s tests; #significant difference between Chx and the other groups (F, F + p1025, F + Chx), except for p1025, considering each time of exposure separately, according to ANOVA/Tukey’s tests. Columns indicate means and bars indicate standard deviations (n=12). Different letters show significant differences among times of exposure (5, 30, or 60 minutes), considering each group separately, according to ANOVA/Tukey’s tests.
Abbreviations: F, liquid-crystalline formulation; p1025, peptide p1025; Chx, chlorhexidine; ANOVA, analysis of variance.
