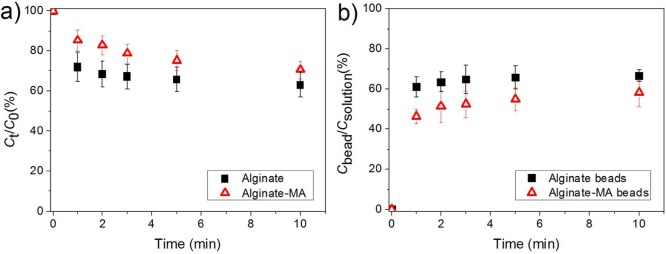
Figure 5.
Plots of (a) normalized FITC-AHL concentration in the solution against time and (b) ratio between FITC-AHL concentration inside the beads and in the surrounding solution over time; the same volume of alginate or alginate-MA beads was immersed in the FITC-AHL solution. The data are presented as arithmetic mean ± standard deviation calculated from at least three replicates.

