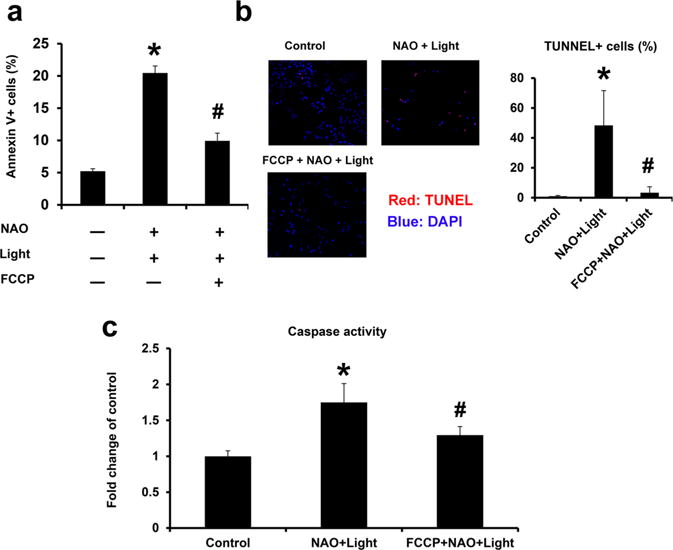
Figure 3.

FCCP shown to protect cells against apoptosis induced by NAO and light exposure. Cells were pretreated with 40 μM FCCP before NAO staining and light exposure. (a) Cells were collected for analysis of PS externalization by Annexin V binding at 24 h after treatments. (b) Cells were collected for analysis of TUNEL and DAPI staining at 48 h after treatments. Shown on the left panel are representative images from control, NAO + light, and NAO + light + FCCP groups. The red color is the TUNEL stain overlaid on the DAPI (nuclear) stain. Shown on the right are averaged quantitative results showing the number of TUNEL positive cells (normalized to the number of DAPI positive cells) in these three groups. (c) Measurement of caspase activity at 24 h after NAO and light exposures. Mean ± SD (N = 3). *p < 0.05 vs nontreated controls. #p < 0.05 vs NAO and light treatments.
