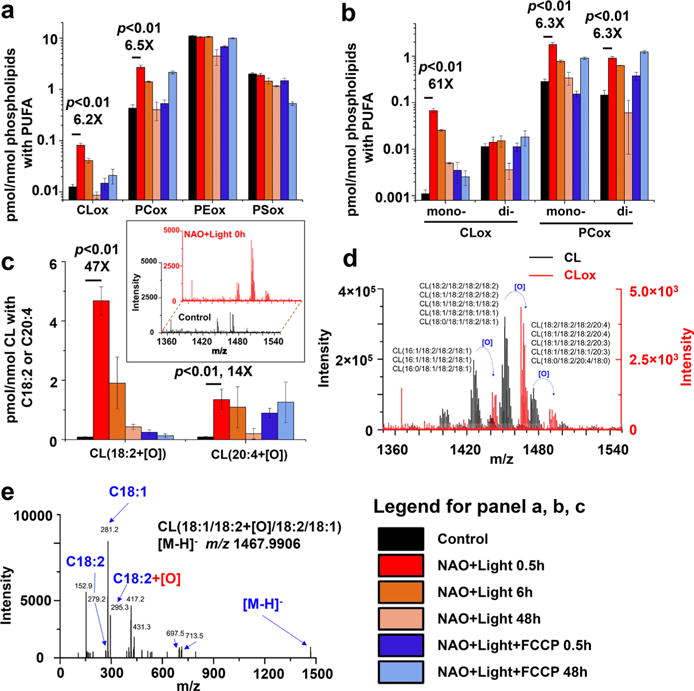
Figure 4.

Redox opto-lipidomics identifying C18:2 mono-oxygenated CL species as pro-apoptotic signals (a) Total levels of oxygenated PLs in HeLa cells following the exposure to NAO and light in the absence and presence of FCCP. The amounts of oxygenated species in major PL classes were normalized to the total contents of PLs with oxidizable polyunsaturated fatty acyls (PUFA). (b) Levels of mono-oxygenated CLs and PCs. The amounts of each oxygenated species were normalized to the total contents of PLs with oxidizable PUFAs. (c) The levels of mono-oxygenated CLs containing C18:2 or C20:4. The amount of each oxygenated species was normalized to the total contents of CLs with C18:2 and C20:4. Inset: Spectra of oxygenated CLs from control cells (black) and NAO + light exposed cells (red) collected immediately after the light. All values on panels a, b, and c are means ± SD (N = 3); also shown numerically are fold-changes induced by NAO + Light vs controls. (d) An overlay of a typical MS spectrum of nonoxygenated CL species from the control sample (black) and of oxygenated CL species (red) from the NAO + Light (0.5 h) sample (red) indicates the mono-oxygenated C18:2-containing CL species. Note the different scales on the black and red y axes of intensity. (e) Representative MS/MS spectrum of mono-oxygenated CL(18:1/18:2-[O]/18:2/18:1), with an m/z value of 1467.9906 ([M–H]−).
