Figure 5.

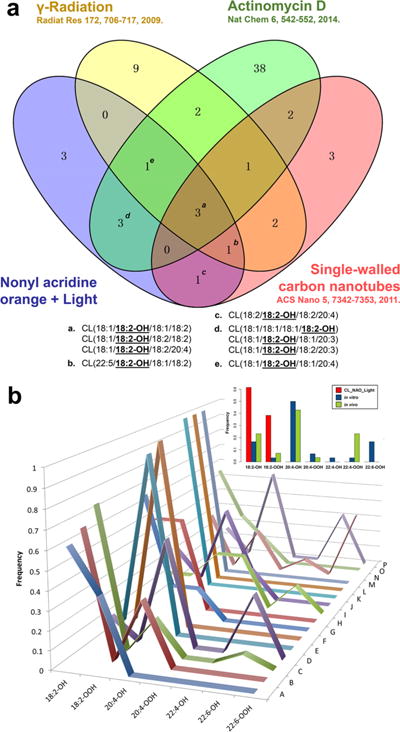
Bioinformatics analysis verifying the commonality of mono-oxygenated C18:2 CL species as pro-apoptotic lipid signals. (a) The four-way Venn diagram demonstrates three mono-oxygenated C18:2 CL species common to the four different pro-apoptotic conditions. The Venn diagram was plotted using VENNY 2.0, http://bioinfogp. cnb.csic.es/tools/venny/. (b) Unigram frequencies of observed oxidized acyl chains upon apoptosis induction by different stimuli highlight mono-oxygenated C18:2 CL species. A, NAO-light (current work); B, actinomycin D (2012);61 C, actinomycin D (2014);19 D, controlled cortical impact;19 E, gamma irradiation (2008);22 F, gamma irradiation (2009);57 G, gamma irradiation (2011, in vitro);22 H, gamma irradiation (2011, in vivo);22 I, hyperoxia;60 J, mechanical injury;58 K, actinomycin D (current work); L, rotenone (2013);56 M, rotenone (2015);62 N, staurosporine;65 O, single walled carbon nanotubes;63 and P, whole body radiation.19 In the inset boxplot, the same frequencies are shown by grouping the stimuli as follows: NAO-light (this work) in red, in vitro (B, C, F, G, J, K, L, and N) in blue, and in vivo (D, E, H, I, M, O, and P) in green. The p value of each comparison by χ-squared test was shown in Supporting Information Table S2.
