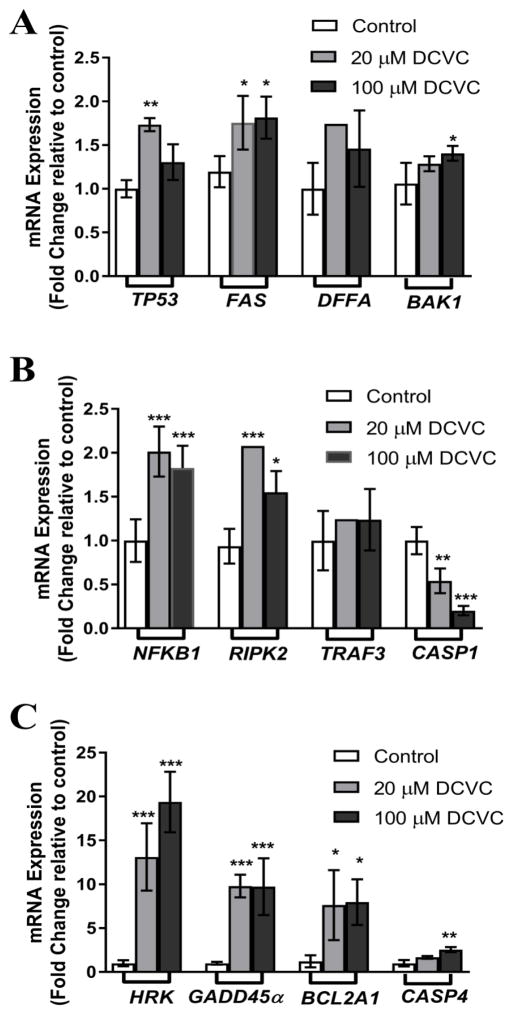
Figure 4. DCVC effects on HTR-8/SVneo cell mRNA expression of genes implicated in apoptosis signaling.
Based on the results of an apoptosis PCR array, we identified ten genes that were significantly upregulated by at least 2 fold or downregulated at least 0.5 fold compared to control, following treatment with 100 μM DCVC for 24 h. The PCR array data results were confirmed using qRT-PCR. Two other genes were also included in the qRT-PCR analysis because they showed a trend of upregulation. Cells were exposed to 0 (control), 20 μM DCVC or 100 μM DCVC for 24 h followed by qRT-PCR analysis. A) The mRNA expression of TP53, FAS, DFFA and BAK1. B) The mRNA expression of NFKB1, RIPK2, TRAF3 and CASP1. B) The mRNA expression of HRK, GADD45α, BCL2A1 and CASP4. Bars represent means±SEM. * Significantly different compared to control (P<0.05). ** Significantly different compared to control (P<0.01). *** Significantly different compared to control (P<0.001). Data were analyzed by one -way ANOVA with posthoc Dunnett’s multiple comparison. N=3–6 independent experiments. All experiments were performed in triplicate.

