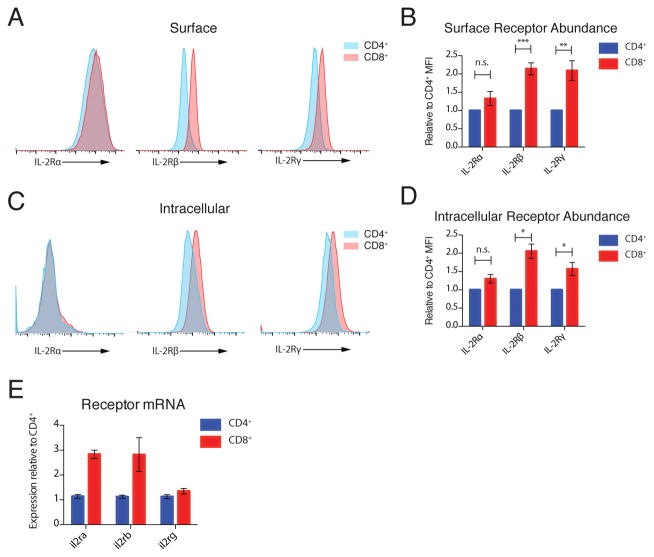
Figure 4. IL-2R Subunit Abundance.
(A) Representative histograms of IL-2Rα, IL-2Rβ and IL-2Rγ staining on the surface of CD4+ and CD8+ T cells. (B) Quantification of receptor abundance relative to mean fluorescence intensity (MFI) on CD4+ T cells in each experiment. (C) Representative histograms of IL-2Rα, IL-2Rβ and IL-2Rγ intracellular staining in CD4+ and CD8+ T cells. (D) Quantification of intracellular receptor abundance relative to MFI on CD4+ T cells in each experiment. (E) Quantification of il2ra, il2rb, and il2rg transcripts in resting CD4+ and CD8+ T cell blasts by qPCR. Data are representative of 7 (A) and 3 (C) independent experiments. Pooled data from 7 (B) and 3 (D) independent experiments, plotted +/− SEM. Paired T-Test: n.s. not significant; * p<0.05, **p<0.01, ***p<0.001. (E) mRNA from 3 biological replicates plotted with 95% confidence interval.

