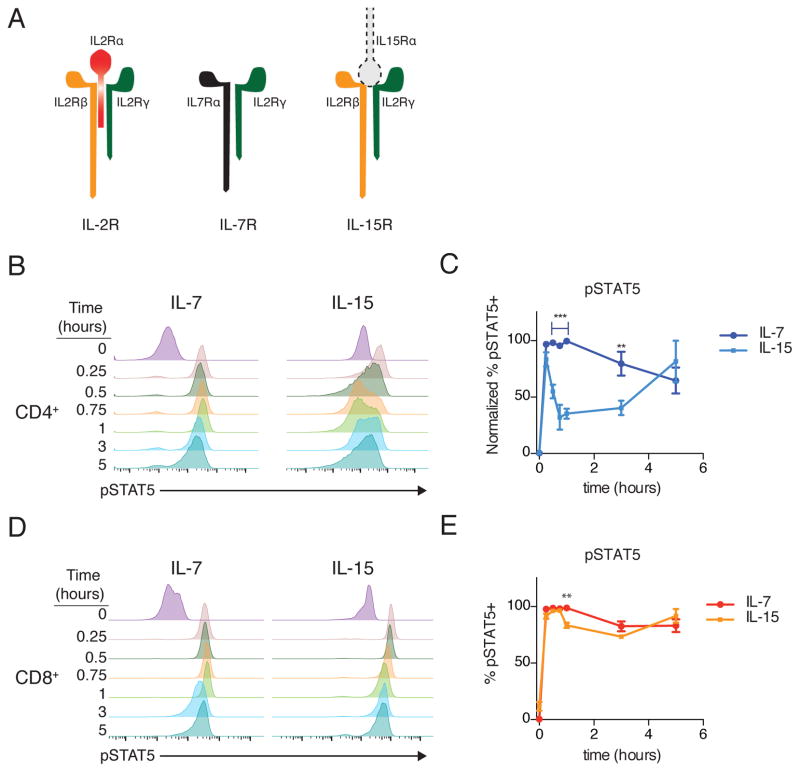
Figure 5. Comparative dynamics of IL-7 and IL-15.
(A) Schematic of IL-2, IL-7 and IL-15 receptor components. Note IL-15 is typically presented in trans from IL-15Rα on a neighboring cell. (B) Representative time course histograms of phosphorylated STAT5 (pSTAT5) in CD4+ T cells stimulated with IL7 or IL-15. (C) Fraction of pSTAT5+ cells in response to IL-7 and IL-15. Cytokine, time and interaction p<0.0001. (D) Representative time course histograms of pSTAT5 in CD8+ T cells stimulated with IL7 or IL-15. (E) Quantification of pSTAT5 in response to IL-7 or IL-15. Cytokine n.s., time p<0.0001, interaction p=0.0004. Data is representative of (B, D) or pooled from (C, E) 3 independent experiments. Plotted +/− SEM in (C, E). Time courses compared by repeated measures ANOVA with Bonferroni multiple comparison test (significant p<xxx: ** p<0.01, *** p<0.001 for IL-7 vs IL-15 at a given time point).

