
Figure 4. Mdr1 Regulates Effector T Cell Function in the Presence of Bile Acids.
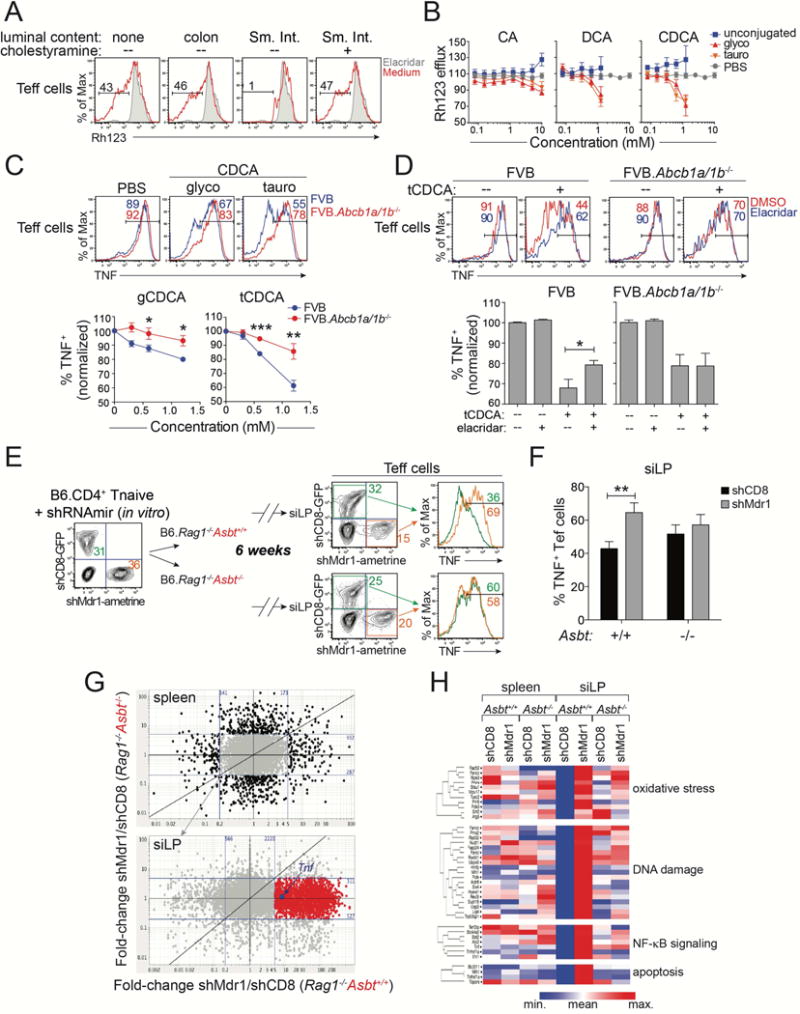
(A) Rh123 efflux in splenic FVB wild-type CD4+ effector T cells (Teff cells) after in vitro treatment without (none) or with lumen content from colon or small intestine (Sm. Int.) (red). Sm. Int. content was pre-treated +/− cholestyramine to deplete bile acids. Elacridar-treated cells (shaded) show background. Representative of 5 experiments.
(B) Dose-responses (+ SEM; n = 3) of synthetic bile acids on splenic FVB wild-type Teff cell Rh123 efflux. Unconjugated (blue), glycine-(glyco; red), or taurine-(tauro; orange) conjugated bile acids: cholic acid (CA), deoxycholic acid (DCA), chenodeoxycholic acid (CDCA). Vehicle (PBS)-treated Teff cells are shown (grey); data are normalized to cells in media alone. Incorporates data from 3 experiments
(C) Top, TNF expression in in vitro-stimulated splenic wild-type (FVB; blue) or Mdr1-deficient (FVB.Abcb1a/1b−/−; red) Teff cells after pre-treatment with vehicle (PBS), or glycine (g)- or taurine (t)-conjugated CDCA. Representative of 4 experiments. Bottom, dose responses of CDCA species on TNF expression (+ SEM; n = 4) in wild-type or FVB.Abcb1a/1b−/− Teff cells as above. Data are normalized to vehicle (PBS)-treated cells.
(D) Top, TNF expression in in vitro-stimulated splenic FVB wild-type (left) or FVB.Abcb1a/1b−/− (right) Teff cells treated +/− tCDCA in the presence (blue) or absence (red) of elacridar (0.1 μM). Representative of 8 experiments. Bottom, Percentages of TNF+ Teff cells (± SEM; n = 8) as above. Data are normalized to vehicle (PBS)-treated cells.
(E) Untransduced, shCD8- or shMdr1-expressing B6 wild-type T cells were mixed and transferred into co-housed Asbt-sufficient or Asbt-deficient B6.Rag1−/− mice. Cells were re-isolated from siLP and analyzed 6-weeks post-transfer. Representative of 6 mice over 2 experiments.
(F) Mean percentages (+ SEM; n = 6) of TNF+ shCD8- or shMdr1-expressing siLP Teff cells from transferred and co-housed Asbt+/+ or Asbt−/− B6.Rag1−/− mice in (E).
(G) Gene expression, by RNA-seq, in ex vivo-isolated shCD8- or shMdr1-expressing Teff cells from spleen (top) or siLP (bottom) of congenically-transferred and co-housed Asbt+/+ or Asbt−/− B6.Rag1−/− mice as in (E-F). Fold-change/fold-change plots are shown (blue lines = 5-fold change). Genes changing < 5-fold in spleen (n = 7,341; grey) are shown in siLP. 1659 genes (red), including Tnf (blue), are > 5-fold higher in shMdr1- vs. shCD8-expressing siLP Teff cells from Asbt+/+, but not Asbt−/−, Rag1−/− mice.
(H) Pathway analysis of genes highlighted red in (G).
(G–H) Gene expression values are means from 5 mice per group in one experiment.
* P < .05, ** P < .01, *** P < .001, student’s t test. See also Figure S6-7.