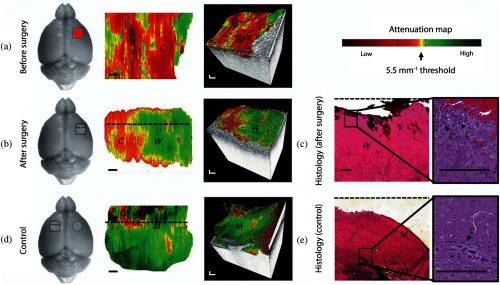
Fig. 3.
In vivo brain cancer imaging in a mouse with patient-derived high grade brain cancer (GBM272). (a and b) Brain tissues were imaged in vivo in mice () undergoing brain cancer resection. After imaging, the mice were sacrificed and their brains were processed for histology. The representative results of a mouse brain at the cancer site before surgery (a) and at the resection cavity after surgery (b) are shown. (c) Corresponding histology for the resection cavity after surgery. (d and e) From the same mouse, (d) control images were acquired from a seemingly healthy area on the contralateral side of the brain, (e) with the corresponding histology. The red circle indicates cancer, the gray circle indicates the resection cavity, and the square indicates the OCT field of view. Two-dimensional optical property maps were displayed using an attenuation threshold of . Aliasing artifacts at the image boundaries, which were produced when dorsal structures from outside the OCT depth were folded back into the image, were cropped out of image. 3-D volumetric reconstructions were overlaid with optical property maps on the top surface. Optical attenuation properties were averaged for each subvolume of within the tissue block, with a step size of 0.033 mm in the -direction. Each histological image (c and e) represented a cross-sectional view of the tissue block: the image corresponds to a single perpendicular slice through the attenuation map, along the dotted lines in (b) and (d), respectively. Residual cancer cells were marked with black arrows and correspond to yellow/red regions on the attenuation maps (at the level of the dotted line). Abbreviations: C, cancer; W, noncancer white matter; M, noncancer meninges. Scale bars represent 0.2 mm. Figure reprinted with permission from Ref. 16.

