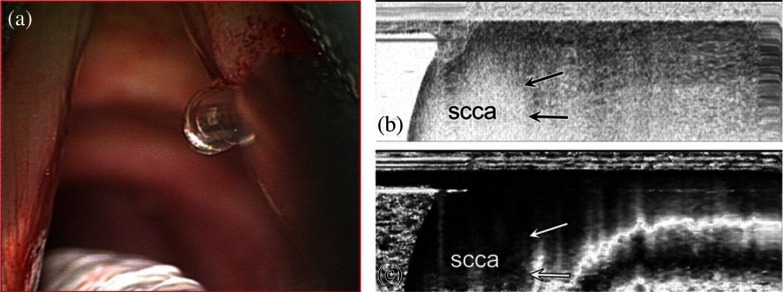
Fig. 9.
(a) Intraoperative view of the glottic surface showing probe placement at the interface between the normal vocal fold and carcinoma on the right side. (b) Conventional OCT image shows a signal void in the area of cancer (scca) with sharp contrast to the gray scale image of normal tissue (arrows). (c) Clear distinction between the cancer, which is seen as a black area on the left side of the image, and normal vocal fold, which contains the light–dark–light banding pattern. Arrow depicts the clear boundary between cancer (scca) and normal. Figure reprinted with permission from Ref. 149.

