
Figure 1. rG4C2 promotes SG formation.
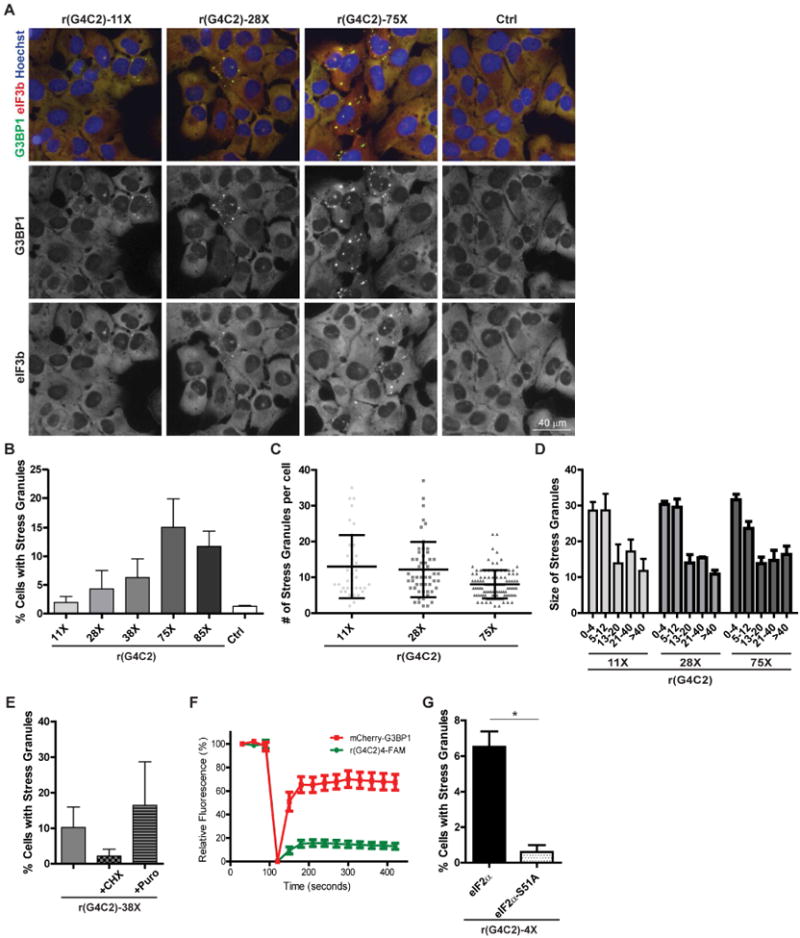
(A) U2OS cells were transiently transfected with equimolar in vitro transcribed rG4C2 of indicated length or vehicle control (Ctrl) for 6 hours then fixed, permeabilized and assayed by immunofluorescence detecting G3BP1 (green) and eIF3b (red) and counterstained with Hoechst (blue) to visualize nuclei. Scale bar is 40 μm. (B-D) Quantification of (A) as the percentage of cells with SGs, (C) number of SGs per cell, and (D) SG size. (E) U2OS cells transiently transfected with rG4C2-38× then treated with puromycin (puro, 5 μg/mL) or cycloheximide (CHX,10 μg/mL) for 30 min prior to fixation. Quantification of the percentage of cells with SG (cells with ≥2 G3BP1 positive foci). (F) FRAP analysis of rG4C2-induced SGs in U2OS cells stably expressing mCherry-G3BP1 and transiently transfected with 3′FAM labeled r(G4C2)4. Graphs represent relative fluorescence of mCherry-G3BP1 (red) and 3′FAM labeled r(G4C2)4 (green) before (first 3 data points) and after photobleaching (last 10 data points). (G) Quantification of the percentage of SG positive wildtype (black bars) or eIF2α-S51A mutant (white with black dots) MEFs transfected with r(G4C2)4. * denotes statistical significance, p<0.05. (B, E-G) Data are represented as mean ± standard deviation (SD), n≥3. (C) >37 cells and (D) >50 foci were quantified per condition across 3 biological repeats. See also Fig S1, S2.