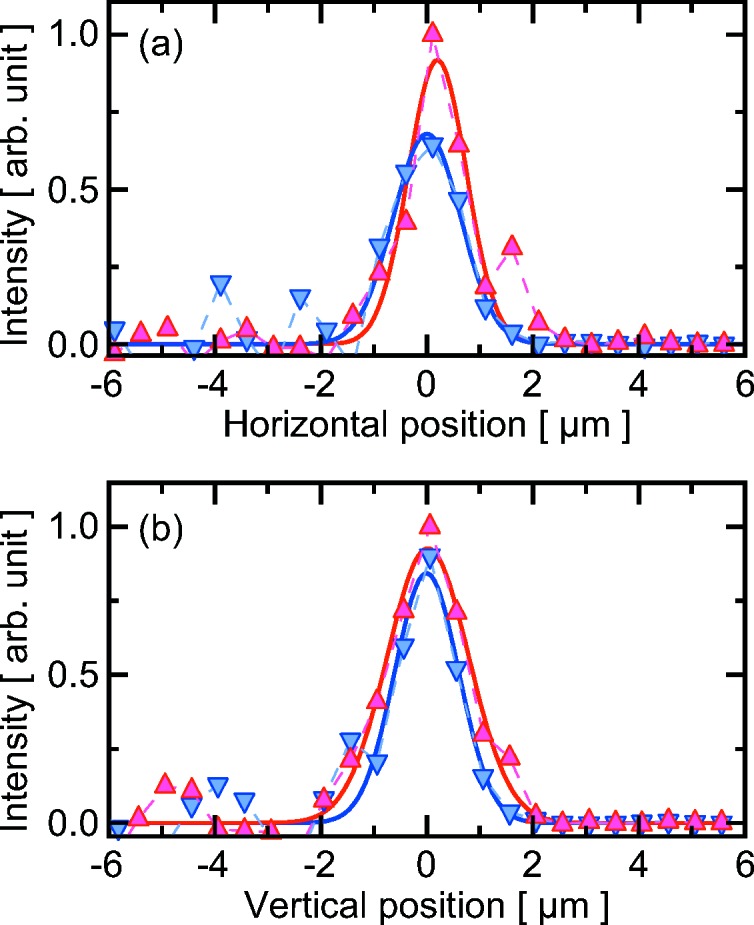
Figure 4.

Averaged profiles of the focused beams in the (a) horizontal and (b) vertical directions. Red triangles and blue inverse triangles represent upper and lower branches, respectively. Each data point was measured using an average of ten shots. Solid curves indicate the fitted lines with the Gaussian functions.
