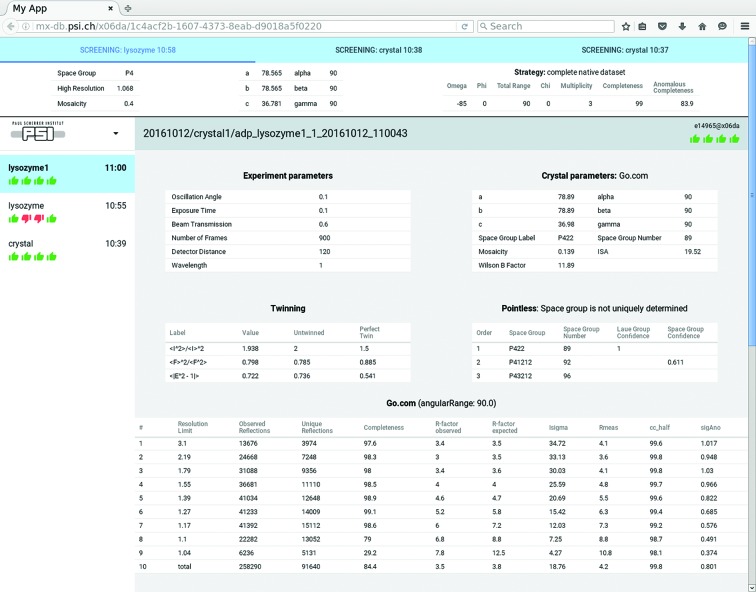
Figure 6.
Results of adp shown in the web-based adp-tracker. The top window displays results of strategy calculation for the last screenshots. Below, results from the last step of automatic data processing with the in-house go.com pipeline for a sample called lyzosyme1 are displayed. Tables include experiment parameters, crystal parameters, twinning analysis, POINTLESS space group determination and final xds CORRECT.LP table.

