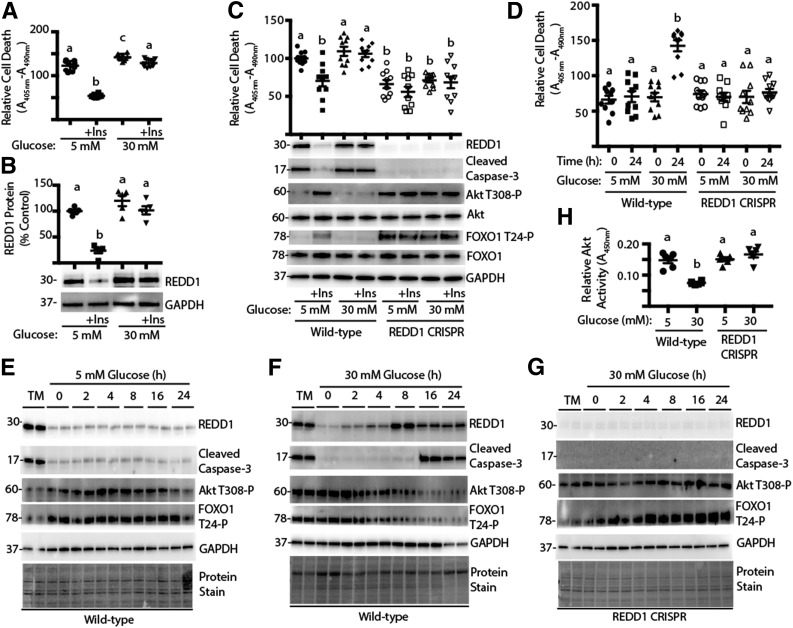
Figure 1.
Deletion of REDD1 protects against hyperglycemia-induced retinal cell death. R28 cells were maintained in DMEM containing 5 mmol/L glucose and supplemented with 10% FBS. A and B: Cells were serum deprived for 24 h in medium containing 5 or 30 mmol/L glucose plus the presence or absence of insulin (+Ins). C: Wild-type and REDD1 CRISPR R28 cells were serum deprived for 24 h in medium containing 5 or 30 mmol/L glucose plus the presence or absence of insulin. D–H: Wild-type and REDD1 CRISPR R28 cells were exposed to medium containing 10% FBS and 5 or 30 mmol/L glucose for 0–24 h. As a positive control for the induction of REDD1 expression, cells were treated with 2 μg/mL tunicamycin (TM) for 4 h. Relative cell death was assessed by ELISA for cytoplasmic nucleosomes. Expression of REDD1, Akt, FOXO1, GAPDH, caspase-3 cleavage, and phosphorylation of Akt and FOXO1 were assessed by Western blotting. Protein molecular mass in kDa is indicated at the left of the blots. Gel loading was assessed by protein stain. Akt activity in cell lysates was assessed by ELISA using a synthetic peptide substrate. Quantification of Western blots is presented in Supplementary Fig. 2. Values are means ± SE for two independent experiments (n = 9–10). Statistical significance is denoted by the presence of different letters above each scatter plot on the graphs. Scatter plots with different letters are statistically different, P < 0.05.

