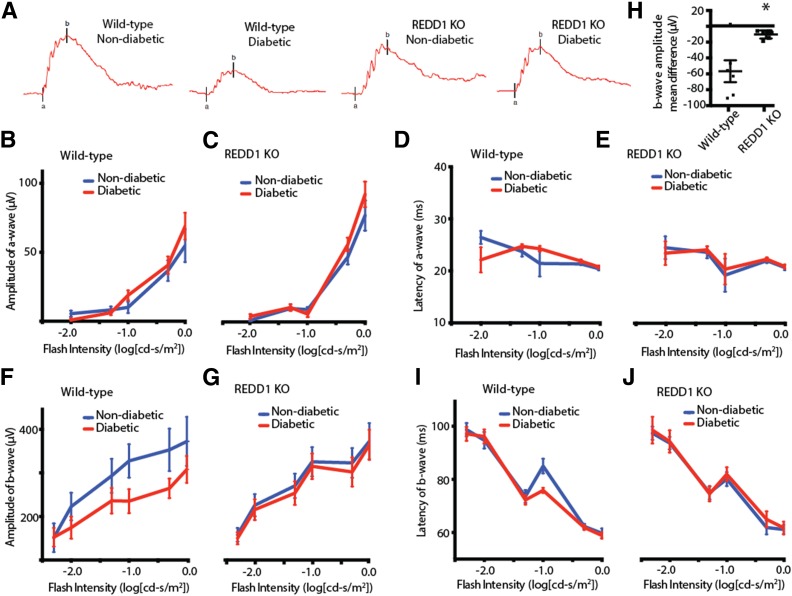
Figure 4.
REDD1 ablation reduces the attenuation of b-wave amplitudes in response to diabetes. At 4 weeks after STZ administration, scotopic ERG responses were recorded from the eyes of diabetic and nondiabetic wild-type and REDD1-knockout (KO) mice at increasing stimulus intensities. A: Representative ERG response elicited from −1.0 cd-s/m2 log flash intensity. ERG a-wave amplitudes are plotted against the stimulus flash intensity for nondiabetic and diabetic wild-type (B) and REDD1-deficient mice (C). The corresponding implicit times are shown for a-waves of nondiabetic and diabetic wild-type (D) and REDD1-deficient mice (E). ERG b-wave amplitudes are plotted against the flash intensity of stimulus luminance for nondiabetic and diabetic wild-type (F) and REDD1-deficient mice (G). H: Mean difference in b-wave amplitudes of nondiabetic and diabetic mice across flash intensities. The corresponding implicit times are shown for b-waves of nondiabetic and diabetic wild-type (I) and REDD1-deficient mice (J). Values are means ± SE for two independent experiments (n = 8). *P < 0.05 vs. wild-type. Graphs in C, E, G, and J share the y-axis with B, D, F, and I, respectively.

