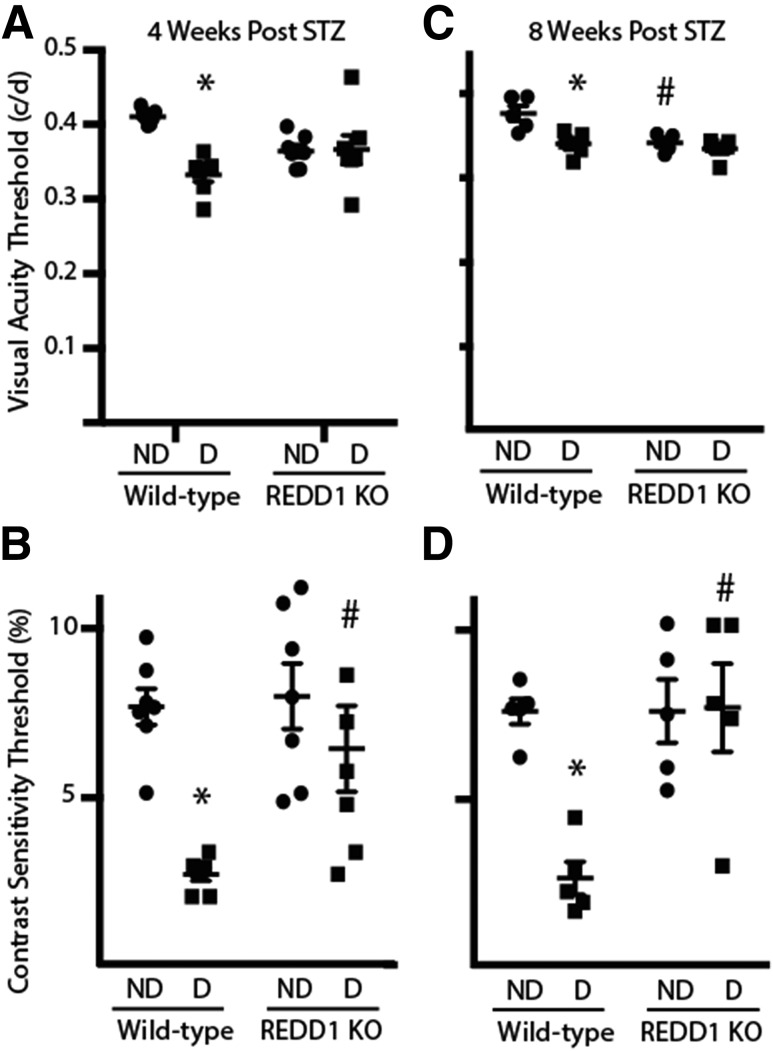
Figure 6.
Diabetes-induced visual dysfunction is absent in REDD1-deficient mice. Visual function was assessed by virtual optomotor testing after 4 (A and B) and 8 weeks (C and D) of diabetes. SF (A and C) and CS (B and D) thresholds and were obtained in nondiabetic (ND) and diabetic (D) wild-type and REDD1-knockout (KO) mice. The CS threshold is expressed as the reciprocal value of the CS score. Values are means ± SE for two independent experiments (n = 5–7). *P < 0.05 vs. control and #P < 0.05 vs. wild-type. Graphs in C and D share the y-axis labels with A and B, respectively. c/d, cycles/degree.

