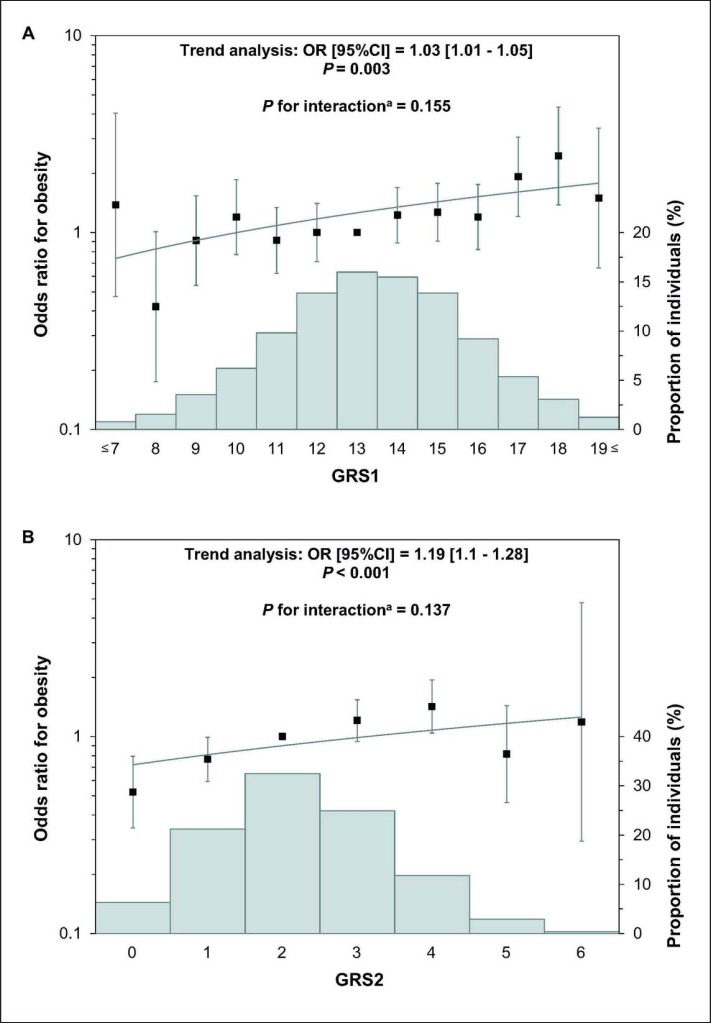
Fig. 3.
Association of GRS1 combining 14 SNPs (A) and GRS2 combining 4 SNPs (B) with obesity in the study populations (joint analyses). Histograms (Y axis on right, grey bars) represent the percentage of individuals in each risk score category. Odds ratios and mean BMI (Y axis on left) are plotted. Error bars represent 95% confidence intervals.

