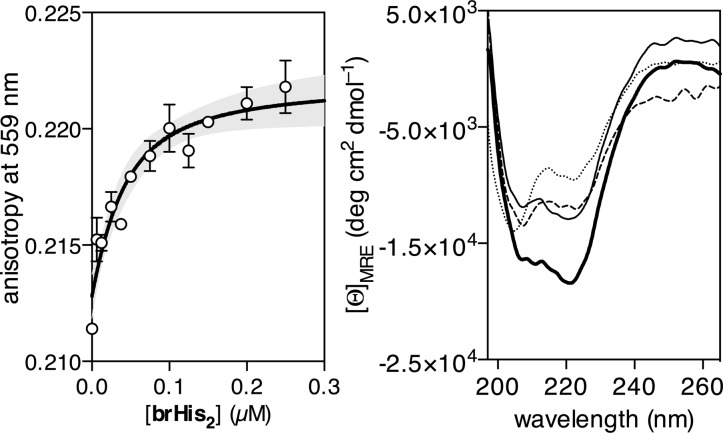
Figure 5.
Left: Representative fluorescence anisotropy titration of a 25 nM solution of the TMR-labeled target ds-oligonucleotide TMR-GTCAT (TMR-5′-CGCGTCATAATTGAGAGCGC-3′, only one strand shown) in the presence of 20 μM Pd(en)Cl2 and increasing concentrations of brHis2. The best fit to a 1:1 binding model is also shown. Measurements were made in 20 mM Tris-HCl buffer pH 7.5 and 100 mM NaCl. Right: CD of a 5 μM solution of brHis2 (dotted line), after the subsequent addition of 1 equiv of the target dsDNA (dashed line), of the same solution after the addition of cis-Pd(en)Cl2 (thick solid line), and after addition of DEDTC demonstrating the reversibility (narrow solid line). All experiments were carried out at 25 °C, in 10 mM phosphate buffer pH 7.5 and 100 mM of NaCl. The contribution of DNA to the CD spectrum has been subtracted for clarity. Mean residue molar ellipticity (MRE) was calculated with respect to the 24-mer brHis2.

