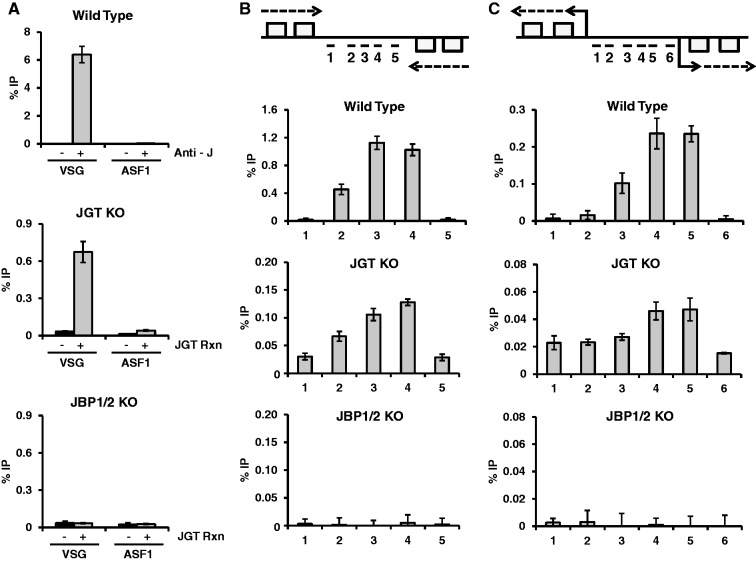
Figure 6.
Mapping 5hmU in the T. brucei genome. Genomic DNA from the JGT KO and JBP 1/2 KO T. brucei cell lines was incubated with JGT and UDP-glucose and J-DNA was enriched by anti-J IP. Anti-J IP of WT T. brucei DNA was used as a control to demonstrate the normal distribution of base J. qPCR analysis of J IP for the indicated regions of the genome was performed as described in the “Material and methods” section. The %IP was calculated relative to input DNA. Error bars indicate standard deviation of three independent replicates. (A) Analysis of base J and 5hmU at the silent 224 VSG (VSG) and the ASF1 gene. Specificity of the anti-J IP reaction is indicated by the %IP in WT DNA with and without addition of the J antisera. Specificity of the 5hmU mapping method is indicated by the %IP with and without in vitro JGT incubation in JGT KO and JBP1/2 KO DNA. (B and C) 5hmU profile at a transcription termination site and a transcription initiation site. Above, diagram of a transcription termination site for two convergent polycistronic units of chromosome 10 (region 2500–2530 kb) (B) and a transcription start site for divergent units on chromosome 10 (region 1620–1640 kb) (C). Boxes represent genes on the top and bottom DNA strand, arrows indicate direction of transcription. Location of qPCR primers spanning the known peak of base J in WT cells is indicated. The %IP was calculated relative to input DNA and normalized to the minus base J antisera (WT) or minus JGT control (JGT KO and JBP1/2 KO).

