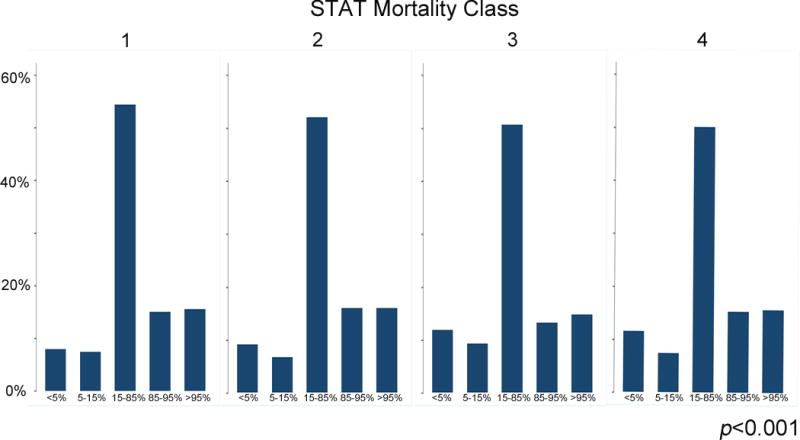
Figure 2. Distribution of subject BMI category and STAT mortality category.

This histogram depicts the distribution (percent) of subject BMI category (x-axis) within each STAT Mortality Class (y-axis).

This histogram depicts the distribution (percent) of subject BMI category (x-axis) within each STAT Mortality Class (y-axis).