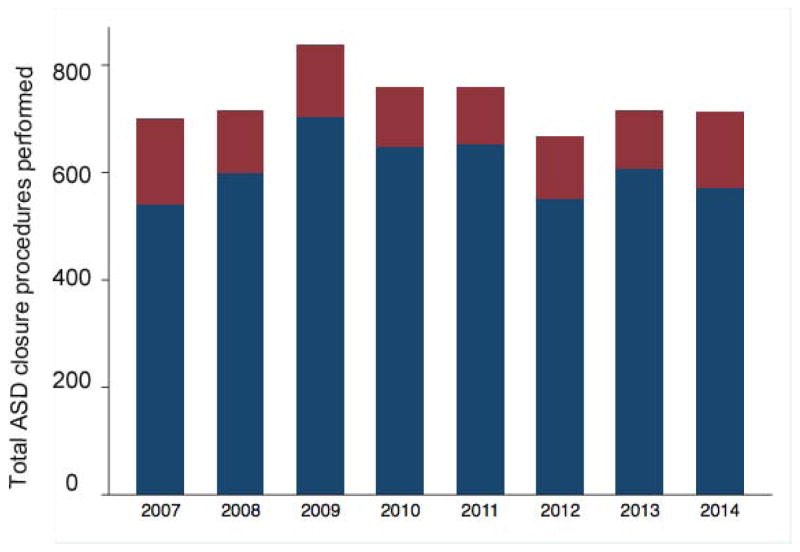
Figure 1. Total ASD closure cases from 2007–2014.
Bar graph depicting the total ASD closure procedures performed, as well as the number of operative ASD closure (maroon) and transcatheter device closure (navy blue) procedures. No significant change in the total number of ASD procedures (p=0.53), operative ASD procedures (p=0.43), or transcatheter device closure of ASD (p=0.8) was seen.

