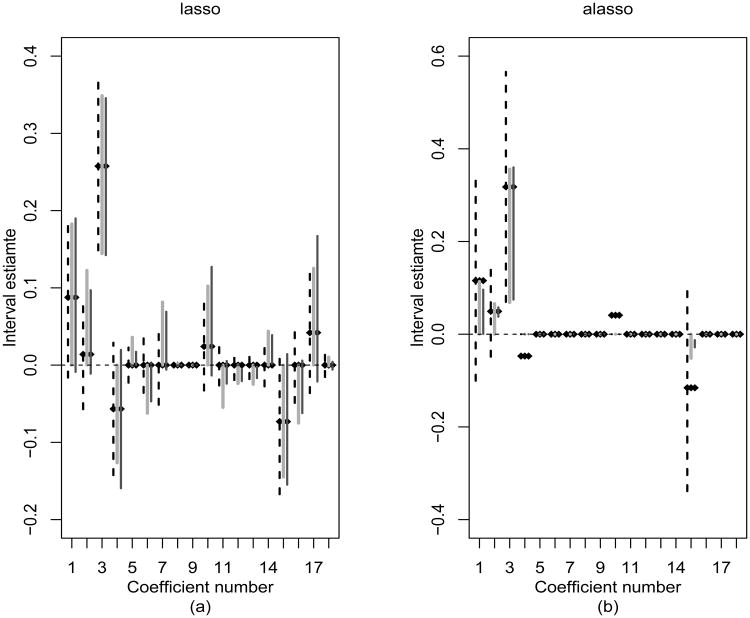
Figure 1.
95% confidence intervals for the penalized cost-scale regression coefficient estimates. Each coefficient estimate has three interval estimates based on methods from Section 3: normal (dashed), percentile (light gray), and HDR (dark gray). Coefficient numbers across the x-axis are annotated in Tables 1–2.

