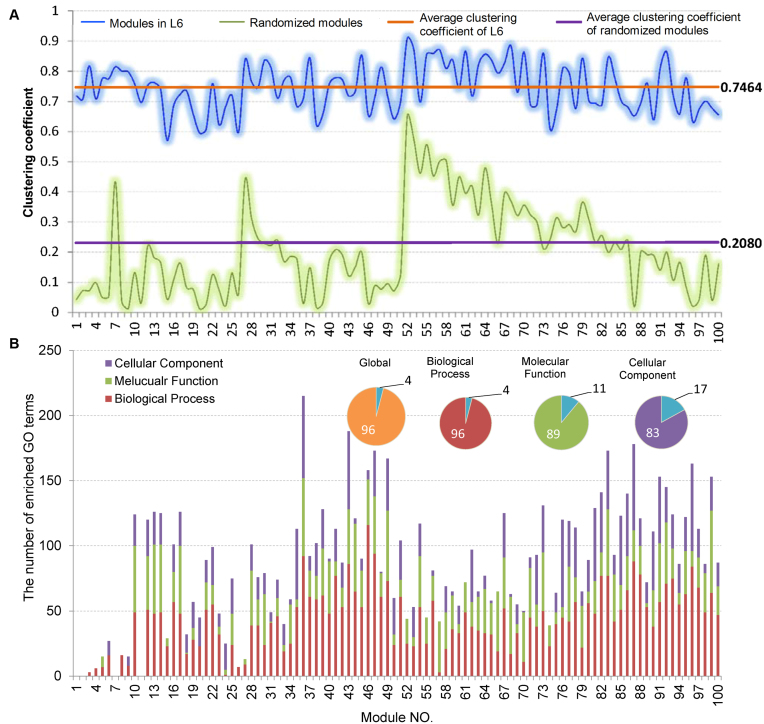
Figure 5.
Topological and functional analysis on the optimally partitioned bilayer modules. (A) The clustering coefficient distribution of the 100 modules at L6. Horizontal lines indicate the average cluster coefficients. (B) The statistics for GO functional enrichment of the 100 modules at L6. Inset pies show the percentage of enriched (color filled) and unenriched (blue filled) modules.

