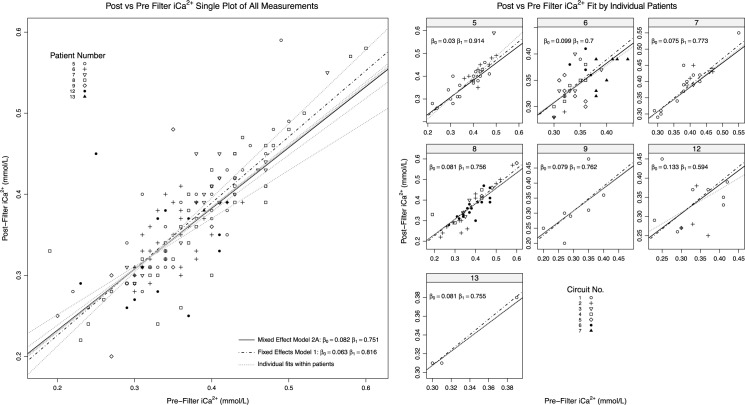
Fig 2. Relationship of post and pre-filter iCa2+ samples grouped by: Full dataset (top), and by circuits nested within individual patient/anticoagulation strategy (bottom panels).
Trend line is fit from linear mixed Model 2A by each grouping; dotted line in lower panels utilises patient specific intercepts and slopes, a non-mixed effects trend line (Model 1) is also displayed. All outliers are included.

