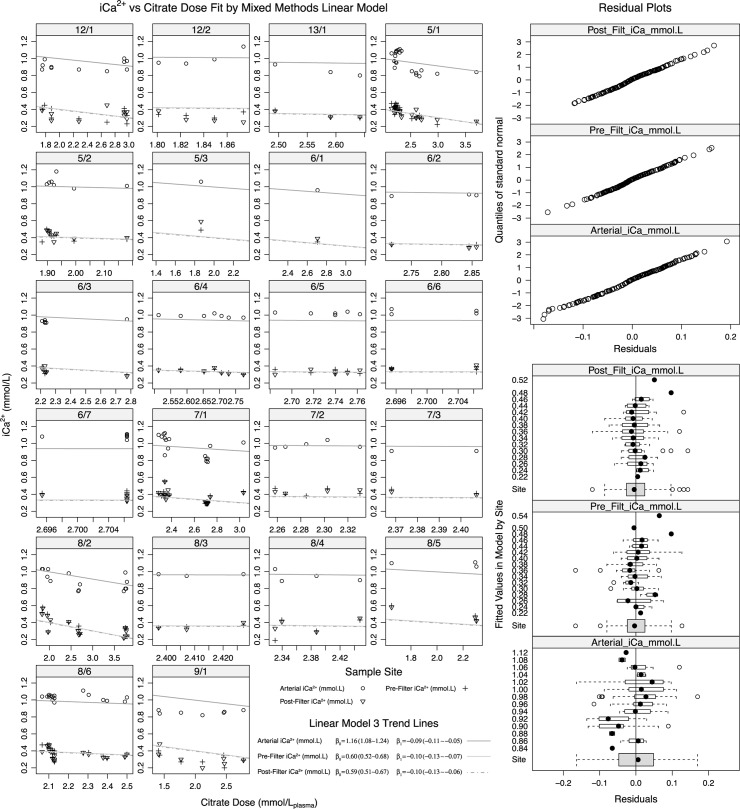
Fig 3. Model 3 fit comparing iCa2+ by site and citrate dose by circuits nested within patients.
The fit for pre and post filter. β0 denotes model intercept, β1 denotes slope (iCa2+ decrement per unit increase in citrate dose). Quantile residual plots demonstrate variance of fit from normal curve. Fitted residuals (bottom right) graphically illustrate variance across measured observations and by site.

