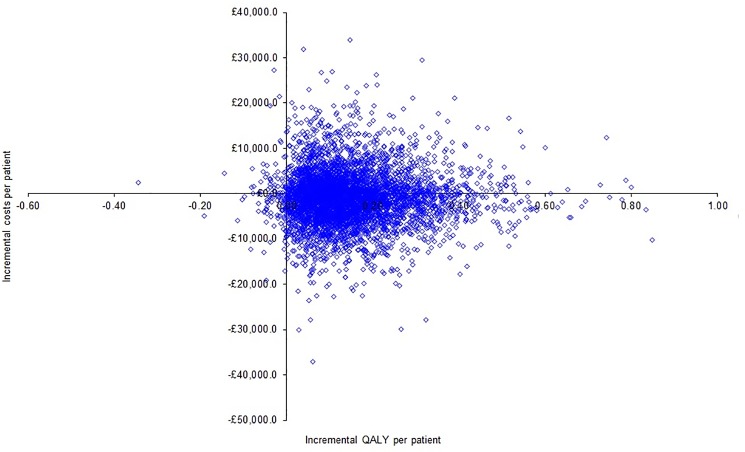
Fig 2. Scatter plot of incremental cost per incremental quality-adjusted life year.
The scatter plot shows that the points lie almost symmetrical about the X-axis, i.e. the costs were similar between laparoscopic and open distal pancreatectomy, but most points lie to the right of the Y-axis, i.e. laparoscopic distal pancreatectomy was associated with increased quality-adjusted life years (QALYs).

