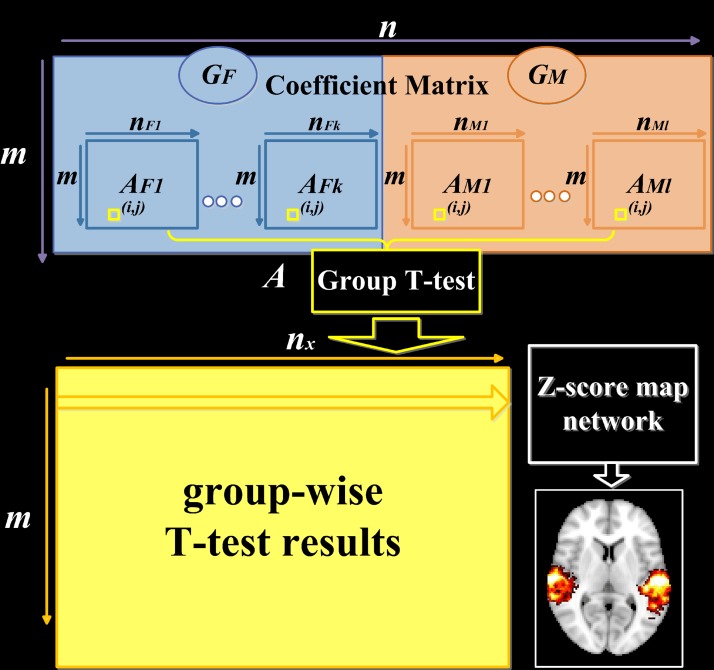
Fig 2. The computational framework of group-wise statistical analysis.
Coefficient matrix A is composed of two groups of subjects (GF: k female subjects, GM: l male subjects). Each row in group T-test represents a component network, which is then mapped backed to brain volume color coding with z-scores and called z-score map (nF1 = … = nFk = nM1 = … = nMl = nx). Each row of sub-coefficient matrices Ax (AFp or AMq) representing individual coefficient spatial map of all the subjects are set as input of SPM12 for two-sample t-tests.

