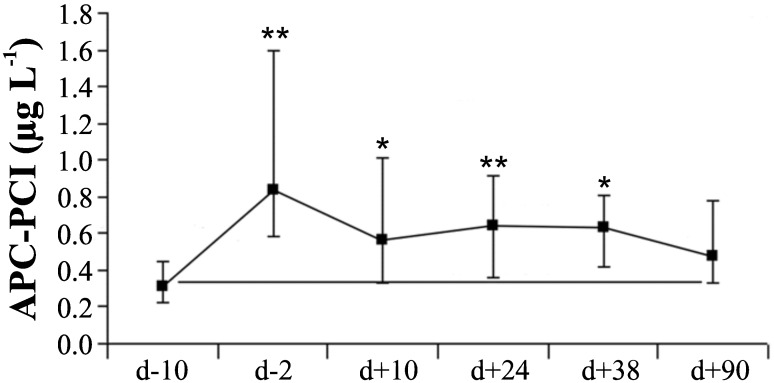
Fig 2. Variability of APC-PCI between different time points during allogenic SCT.
Activated protein C complexed with its inhibitor (APC-PCI) was measured at 6 time points. Data are presented as median values and error bars as the 25th and 75th percentiles; comparisons were with baseline values; d = transplantation/graft infusion day; * = p < 0.05; ** = p < 0.001.

