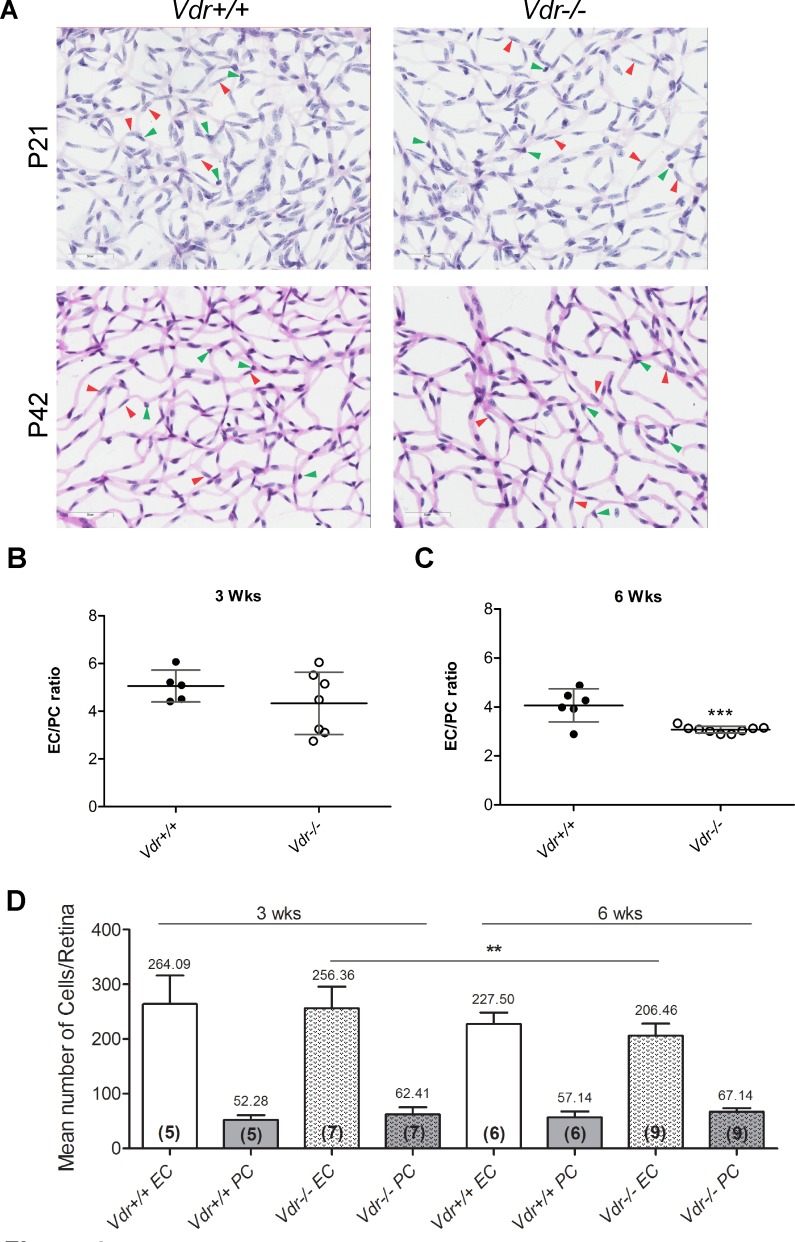
Fig 4. Altered vascular cell density and EC/PC ratios in Vdr -/- mice.
Retinas from P21 and P42 mice were prepared by trypsin digest and H&E/PAS staining. Slides were then scanned and images captured at x400. (A) Representative images are shown; Scale bar = 50 μm. Number of EC (red arrow head) and PC (green arrow head) were counted for at least 6 images per mice, and EC/PC ratio calculated for P21 (B) and for P42 (C) mice; (***P = 0.0008). (D) The quantitative assessment of this data, and the number of EC and PC along with the number of retinas counted in each group in parentheses, are shown. (n≥ 5; **P = 0.0043).

