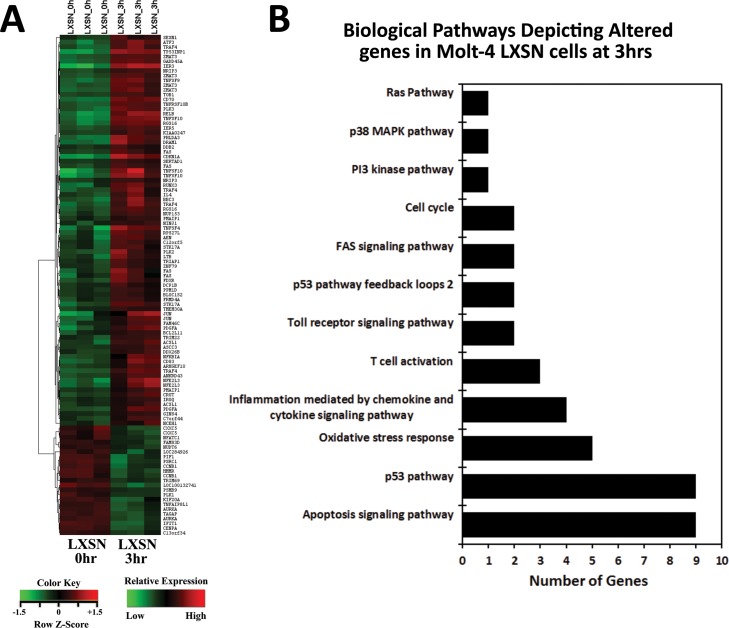
Fig 2. Microarray analysis of altered genes in irradiated Molt-4-LXSN cells at 3hrs vs. 0hr.
(A) Heat map from hierarchical clustering analysis of the differentially expressed genes. Each column represents one sample, and each row refers to a gene. Color legend is represented on the figure. Red indicates genes with higher expression relative to the geometrical means; green indicates genes with lower expression relative to the geometrical means (S6 Table). (B) Biological Process Gene Ontology (GO) analysis of the differentially expressed genes at 3hrs classified into 12 categories, many of which share the same genes according to their functional correlation (S7 Table).

