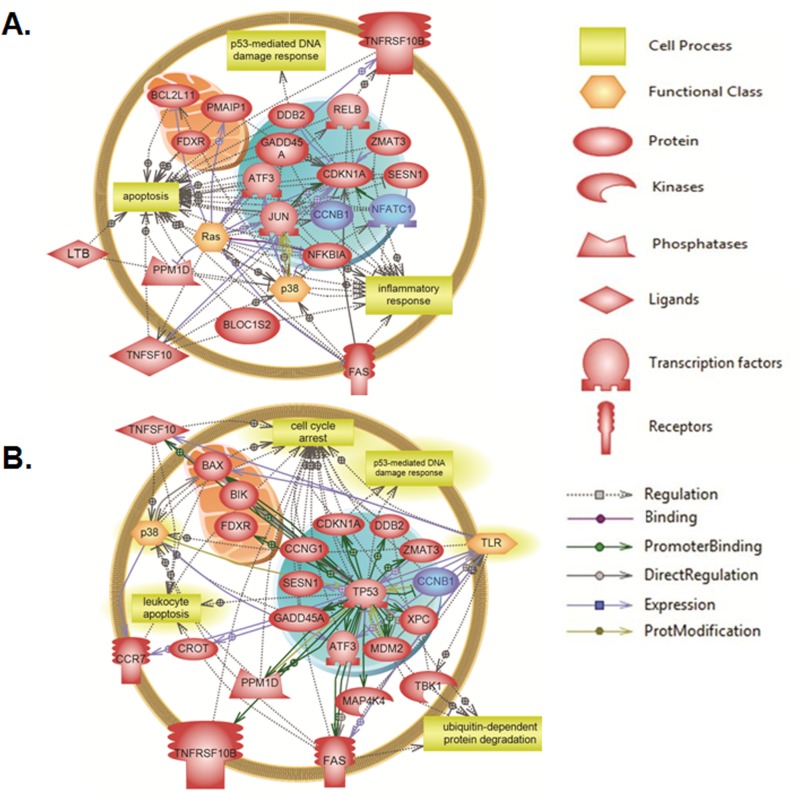
Fig 7. Targeted molecular and biological pathways’ interaction map analysis in Molt-4-LXSN cells.
Using Pathway Studio 10.0, altered genes relevant to γ-irradiation in Molt-4-LXSN cells were analyzed at (A) 3 hours (S11 Table) and (B) 8 hours (S12 Table) post-irradiation. “Direct interaction” algorithm was used to generate and map the targeted network of biological processes and interactions among altered genes. The upregulated genes are shown in light red and downregulated genes are in blue. Each of the proteins is displayed within a subcellular compartment or organelle. The shape of each given protein is indicative of its functional class as shown in the legend. Included in the legend is the definition of the lines connecting 2 genes.

