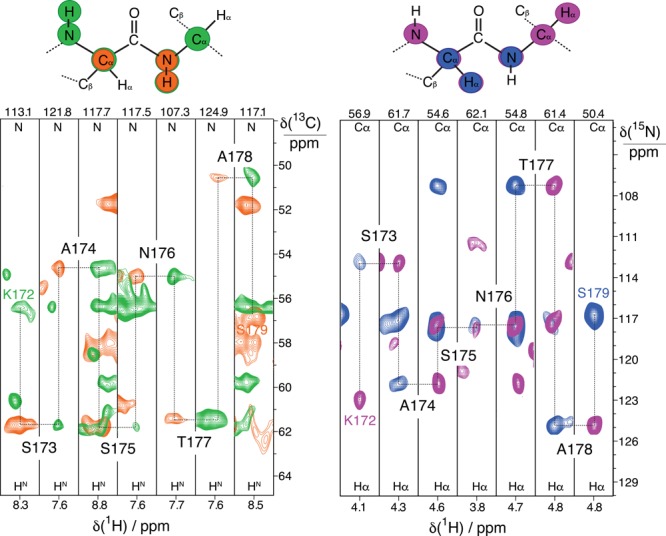
Figure 3.

Sequential assignments of intensity correlations for residues 172–179 in fully protonated proteorhodopsin in lipids bilayers. 2D 1Hα–13Cα slices extracted from (H)CANH (green trace) and (H)(CO)CA(CO)NH (orange trace) spectra are shown in the left panel, and 2D 1H–15N slices from (H)NCAHA (magenta trace) and (H)N(CO)CAHA (blue trace) spectra in the right. The four spectra were acquired at 100 kHz MAS and 23.5 T.
