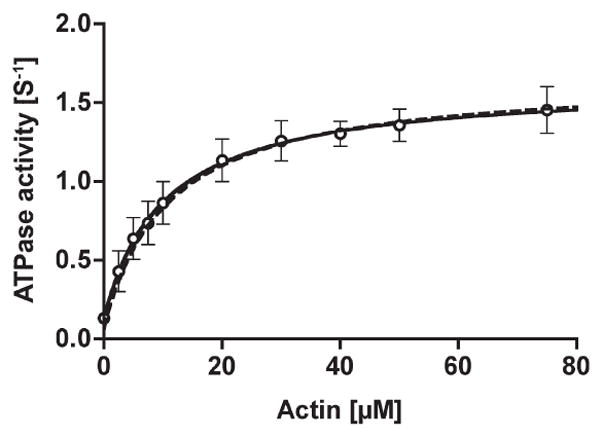
Figure 2.

The steady-state ATPase activity of phosphorylated huM3AMD. The ATPase activity of the p-huM3AMD was measured in the presence of an ATP regeneration system and various concentrations of actin. The solid curve is the best fit to Michaelis–Menten kinetics with Vmax and Kactin values of 1.6 s−1 and 10.3 μM, respectively. The dashed line is simulated on the basis of the parameters obtained in this study (see Discussion), giving a Vmax of 1.67 s−1 and a KATPase of 10.9 μM. The error bars represent the standard error from three independent experiments.
